To Add and Visualise Statistical Data:
-
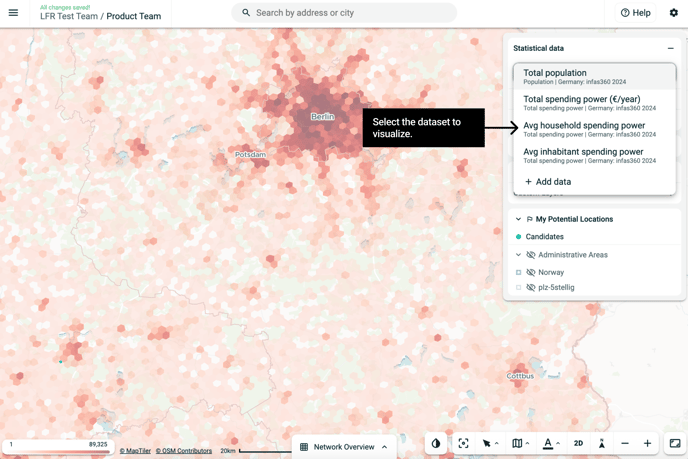
Go to the Statistical Data section

-
Open the dropdown menu and click Add Data
Or click the Settings button and choose Add Data


-
Choose the type of statistical data you want to display
(e.g., demographics, income and spending etc.)
-
Select your dataset and click Next

-
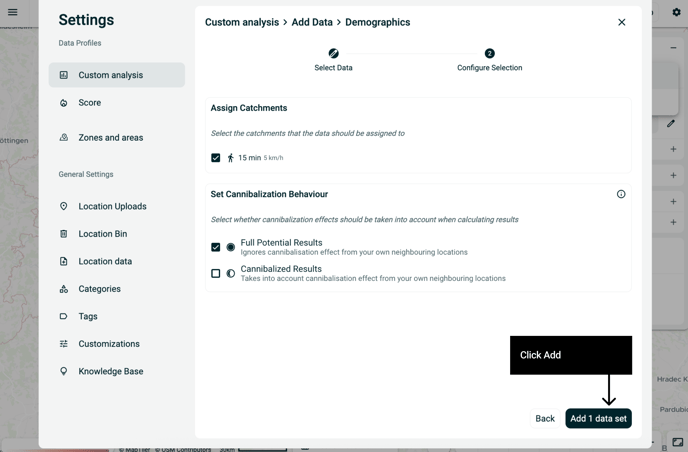
Choose your catchment area (e.g., 10-min drive, 5 km radius)
-
Decide how you want to model impact:
-
Full Potential Results
Shows total opportunity — ignores cannibalization from nearby own locations -
Cannibalized Results
Adjusts for overlap with your own locations in the same catchment
-

7. Click Add Dataset to complete
8. Select the dataset to visualize on the map.