Once you have added performance data about your locations (revenues, orders, guests), Targomo calculates how it correlates with the data that is already in the project. As a result, we're able to give you a list of the data that most strongly correlate with your store performance, and therefore might be success drivers.
But just how exactly is this correlation calculated?
To calculate the correlation coefficient, we use the Pearson coefficient correlation method. In mathematical terms, this method calculates the "ratio between the covariance of two variables and the product of their standard deviations" (Wikipedia, sic).
More simply put, this method first looks at whether the variables move in the same direction at the same time. This is the covariance. This video can help you understand more on this key concept.
Then, the Pearson method needs to look at the standard deviation of each variable. The standard deviation is a measure of how data set is spread across a data set. For instance, whilst you can expect the standard deviation of a random sample of bikes size to be low, you can expect the standard deviation of a random sample of planes size to be much higher. This video does a great job at going into the mathematical details.
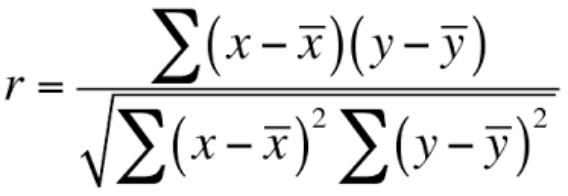
The Pearson coefficient divides the covariance of our variables by the product of their standard deviation. The formula looks like this:
If you want to learn a bit more on this, you can start with this video.
How to read the results
The Pearson’s correlation coefficient returns a value between -1 and 1. The interpretation of the correlation coefficient is as under:
- If the correlation coefficient is -1 or close to -1, it indicates a strong negative relationship. It implies a perfect negative relationship between the variables. For instance: the more schools in your catchment area, the less revenue you make. This negative correlation could mean that you have better chances having a successful location in a non-residential area, which has less schools.
- If the correlation coefficient is 0 or close to 0, it indicates no relationship. For instance, there could be no relationship between
- If the correlation coefficient is 1 or close to 1, it indicates a strong positive relationship. It implies a perfect positive relationship between the variables. For instance, there could be a strong relationship between the movement data Targomo provides and the number of visitors to your store. The less footfall, the less guests.
Higher absolute values indicate a stronger relationship between variables. A correlation coefficient of 0.78 indicates a stronger positive correlation as compared to a value 0.36. Similarly, a correlation coefficient of -0.87 indicates a stronger negative correlation as compared to a correlation coefficient of -0.40.
Limitations of the feature
Whilst we think the correlation feature is a first great step towards understanding your success drivers, it has clear limitation which we feel are important to disclose.
First, when looking at the correlation results, you should alway bear in mind that the more data you add, the more significant they will be. The reverse is also true: the less data you add to your project, the less significant the results will be and the harder it will be to learn insights from them.
Second, correlation does not mean causation. Blogs have been written about this (here's a very funny one). Just because your revenue strongly correlates with a specific age group would not necessarily mean that this age group is a strong driver or predictor of your sales. Consider it as hint that something might be going on there. But to truly learn the underlying factors making your locations successful, a much deeper analysis would be required.
And we can provide it.Our team of data scientist has extensive experience in unveiling key success drivers and build KPI prediction models. Please contact us to learn more.