March 3rd, 2022
(1) Location report customisation
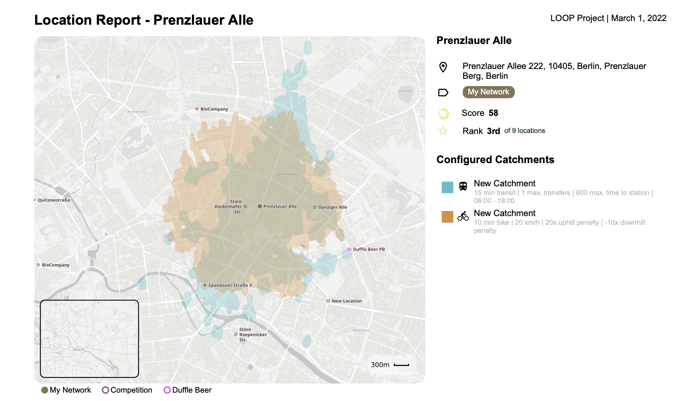
Last week, we announced an update to the interface of the location PDF report. This week, we are making it possible for you to customise the data and the style of your location PDF report.
In the new report, you are now be able to see the names of your locations on the map, if you choose to. Here's what the results look like:
(2) Expand the table full-screen
To give you more clarity when analysing your locations with TargomoLOOP, you can now expand the table to the top of the page. To do so, simply click on the full-screen icon or resize the table by grabbing it at the top.
(3) Hiding the data
In order to give you more control over what you see in LOOP, you can now collapse your catchments when looking at your locations individually. This way, you can focus only on the catchment that matters.
(4) Reorganisation of the visualisation panel
On the visualisation panel, you will now find catchments at the bottom. You can now disable them, should you want to look at a location and analyse data on the map, without the constraint of the catchment.
Another novelty: when your project contains at least one heatmap, you will find them nested under the section "Statistics and heatmaps". This ensures that you do not turn both statistics and heatmaps ON at the same time, introducing potential confusion.