July 1st, 2022
Data drag and drop
When looking at a location, you can now reorder the statistics and POIs, so that the most important information appears on top of less important ones.
Collapse catchments on the table
When looking at the table, you can now collapse catchments, so that you can access the other catchments more quickly, without having to scroll horizontally
A micro-map PDF report
To enrich the PDF report, we have added a new page that lets you see the micro-area near a location. On this page, you can find both a satellite map and a plan. On the plan, information about the location's surroundings (other locations, point of interests) are displayed. 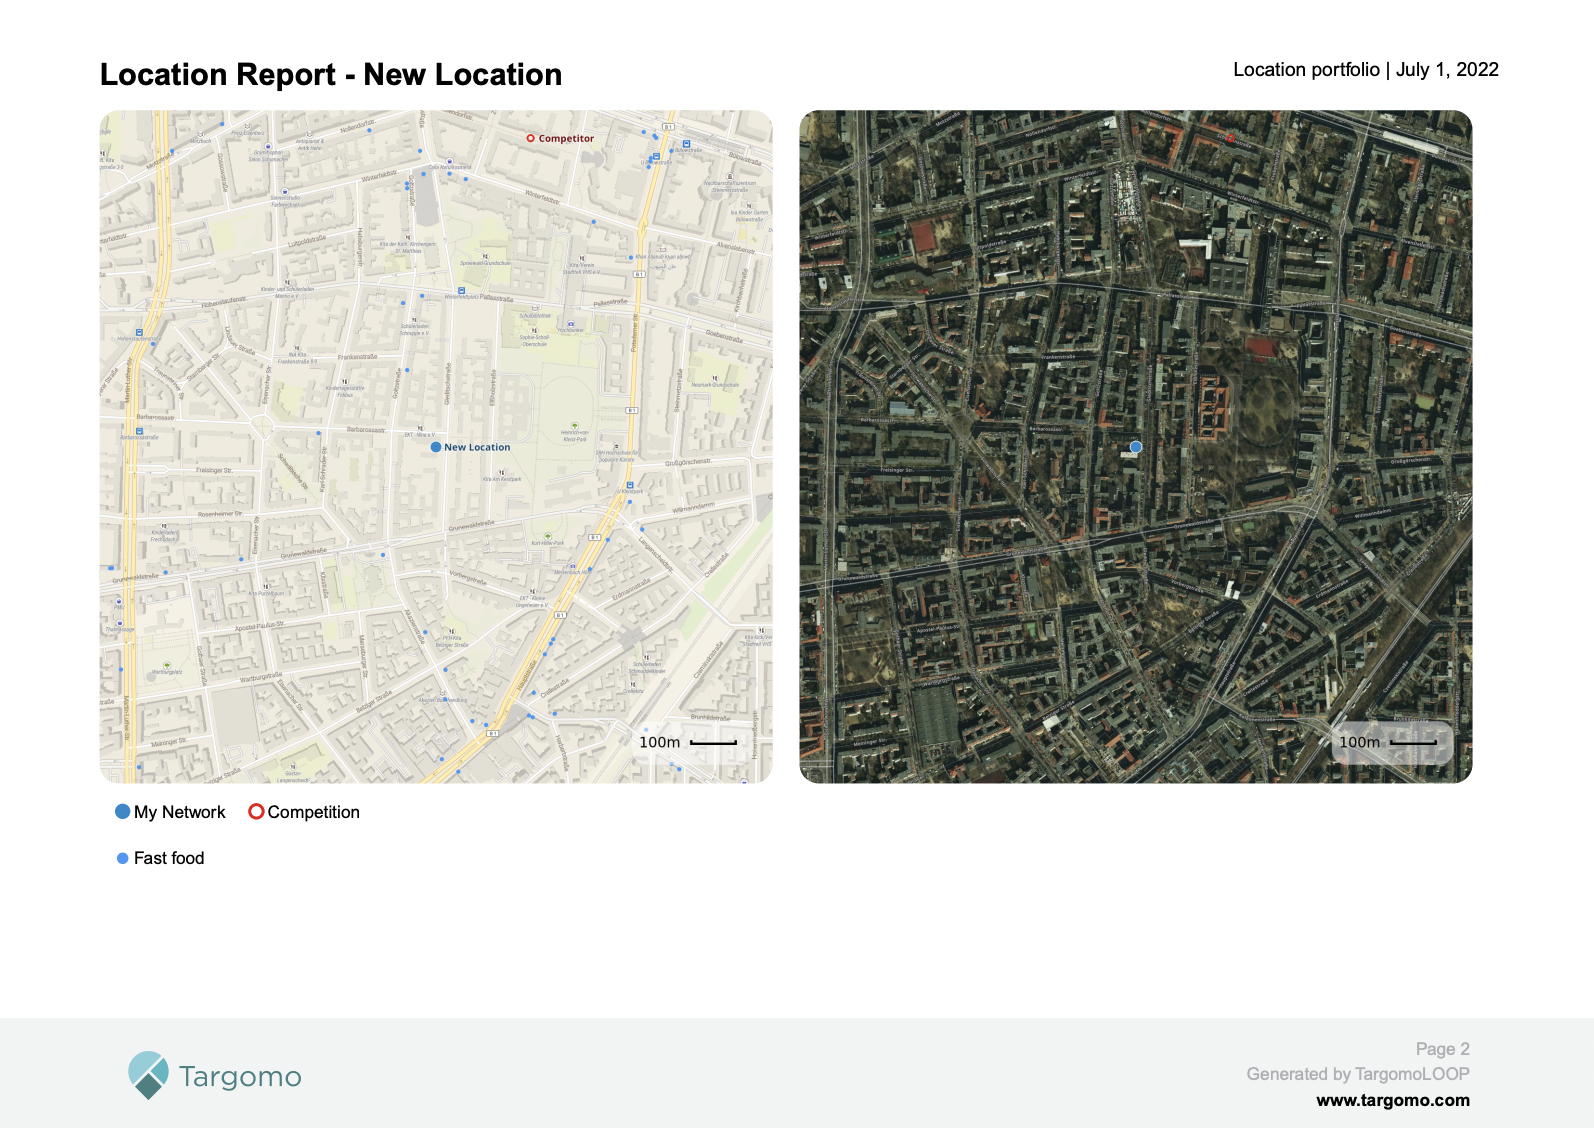
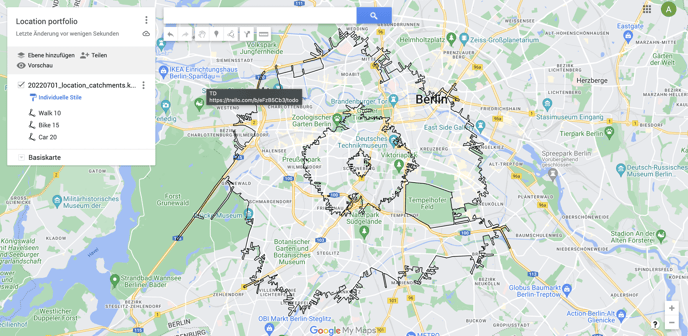
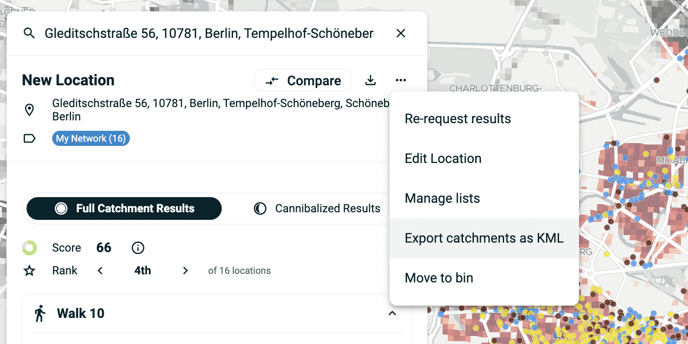
Export catchments as KML
You can now export a location's catchments as KML. This will help you integrate these locations and their catchments back into other softwares such as Google's MyMaps or Google Earth.
To do so, hit "Export catchments as KML" in the 3 dots menu.
Once exported, you can reimport it in other tools, such as Google MyMaps, where it will look like this. Google MyMaps allows you to customise the colour and size of the catchment borders.