October 25th, 2022
Muting locations
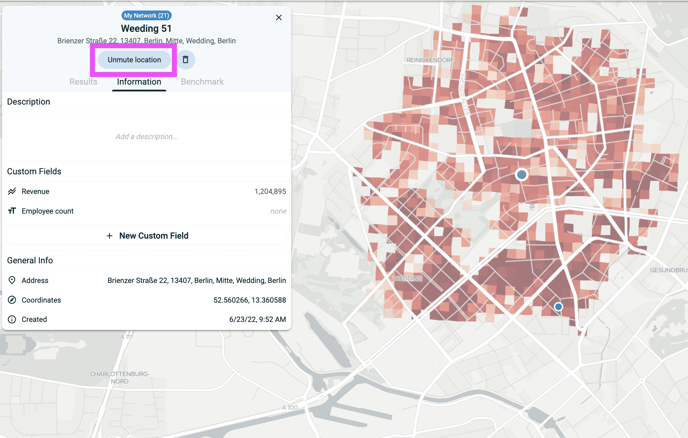
To optimise a network of locations, it is important to simulate many scenarios. That includes analysing the impact of closing a location for instance. To help you do that in TargomoLOOP, we are now introducing a feature called "Muting location". The idea is simple: you can mute one or multiple locations within your network. Your other locations will not be cannibalised by muted locations and will act as though muted locations didn't exist.
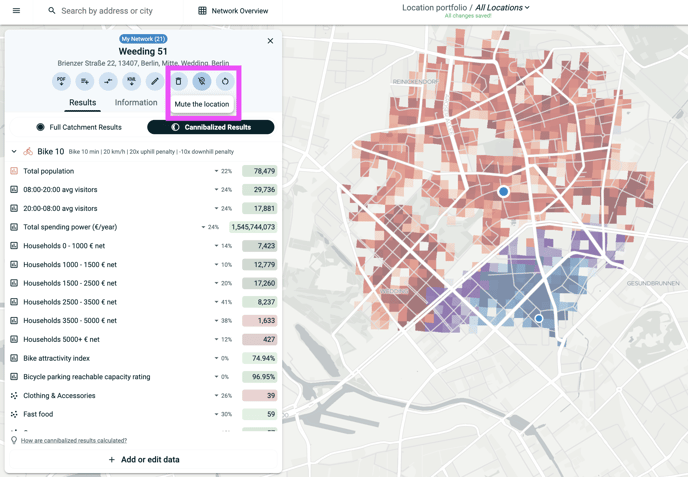
They will however remain visible on the map, so that you can revive them at any time if needed.
Data import redesign
We have significantly redesigned the way points of interests (POIs) and statistical data are added to your project, in order to simplify the experience.
You will now find the statistical data organised under a tree structure. The fractional data (like the share of population by age group) will also be more visible, thanks to the "%" character.
The POIs are now easier to navigate. You are now able to search our POI database more easily and build your own POI groups. A new tab system lets you navigate between the different categories of POIs available.
And because we noticed that most of the data you add to projects is usually added to all catchments, this will now be the default behaviour. You can always remove data from a catchment on the main "Data" page.
A new customisation: hide or show statistics outside catchments
Recently, we heard some feedback pointing out that it is difficult to see the catchment limits when the statistics are enabled, because the colours of the statistics inside and outside the catchment were too similar. A new customisation is now available to prevent this issue: "Display statistics cells outside catchment areas". When it is disabled and you analyse a catchment with statistics ON, on the map, you will now only see the statistical cell within this catchment.