March 23rd, 2022
(1) Add or average the data for all your locations
Have you ever wondered what's the total population reach of all your locations? Or maybe what is the number of young adults that an average location of yours can reach? Or what is the total predicted revenue of all your locations in a specific city or region? LOOP now provides answers to these questions, readily available to you. We have now introduced a footer bar at the bottom of the table.
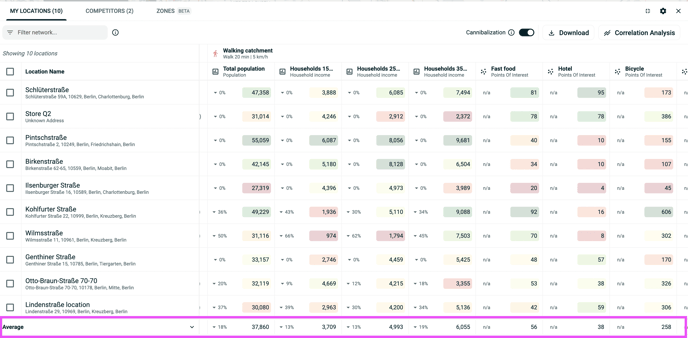
It has two modes: "average" and "sum". Average gives you the mean value of all locations on the table, for each column. Sum gives the total for all the locations within the table, for each column. You can toggle between them like this:
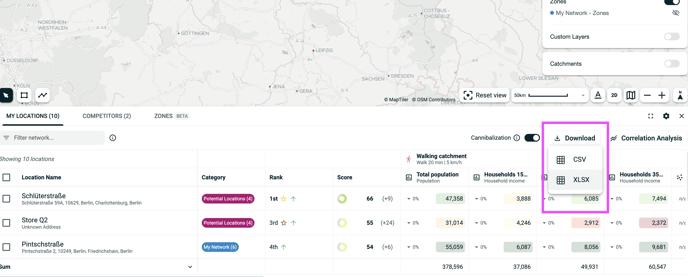
(2) Download Excel sheets
No need to transform CSV to XLSX any more! Both formats are available when you want to download data from the table.
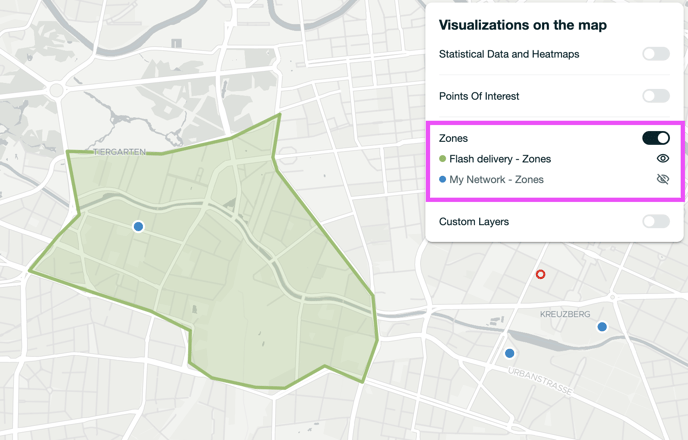
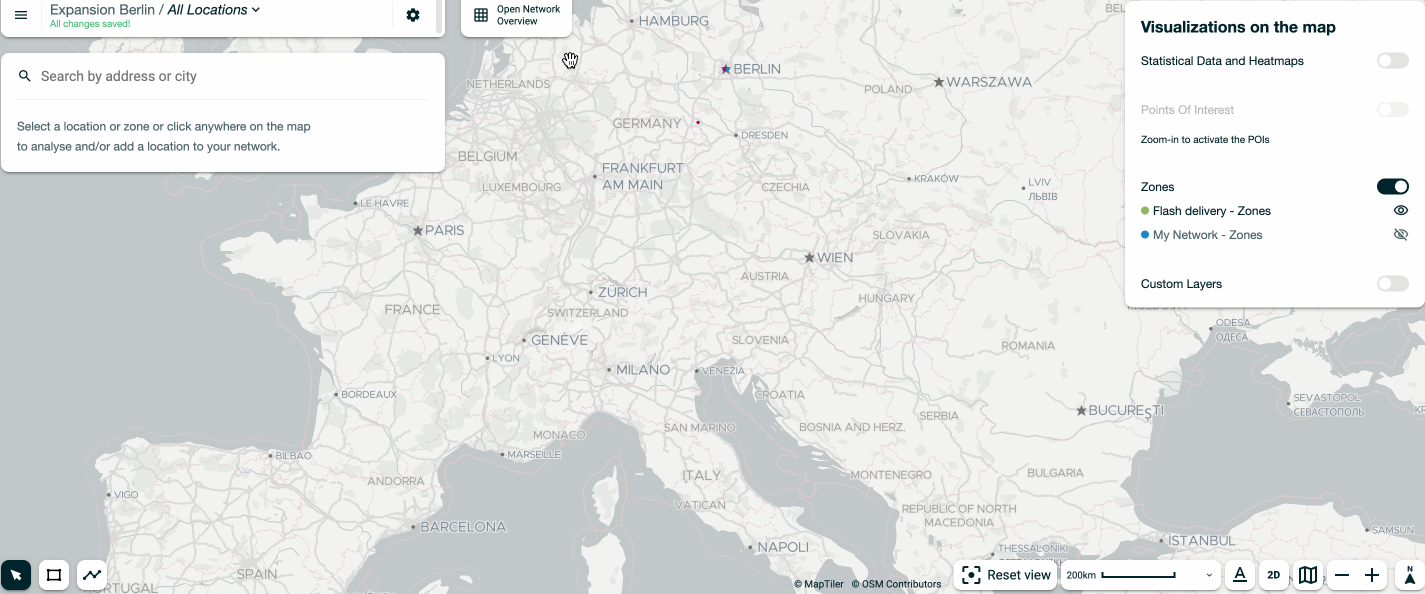
(3) Hiding zones
And finally, for our Beta users of the "zones" feature, you won't be struggling any longer to read the data on the map. By toggling the "Zones" section in the upper right corner of LOOP, you can now hide all zones and choose a specific category of zones you want to hide.