July 26th, 2021
The update of TargomoLOOP on the 26th of July includes two important changes:
- You will now be able to perform multimodal catchment analysis
- Scores can now be calculated based on filtered locations
Let's delve into it.
Multimodal catchment analysis
Up until now, the analysis of your location was only possible one catchment at a time. Regular feedback highlighted that this didn't reflect very well the reality, as your catchment of interest spans over multiple modes of travelling and therefore several catchments, not one. An analysis of a catchment comprised of bike riders within a 15 minutes reachability area is more relevant when it is cumulated with walkers within 10 minutes reachability and car drivers within 40 minutes. That's why we're introducing multimodal catchments analysis.
How does this feature work for you?
Previously, you would define multiple catchments and see their results separately. Now, you will be able to get an analysis spanning over multiple catchments, each defined by a different mode of transportation. Targomo LOOP will therefore enable you to perform a multimodal catchment analysis.
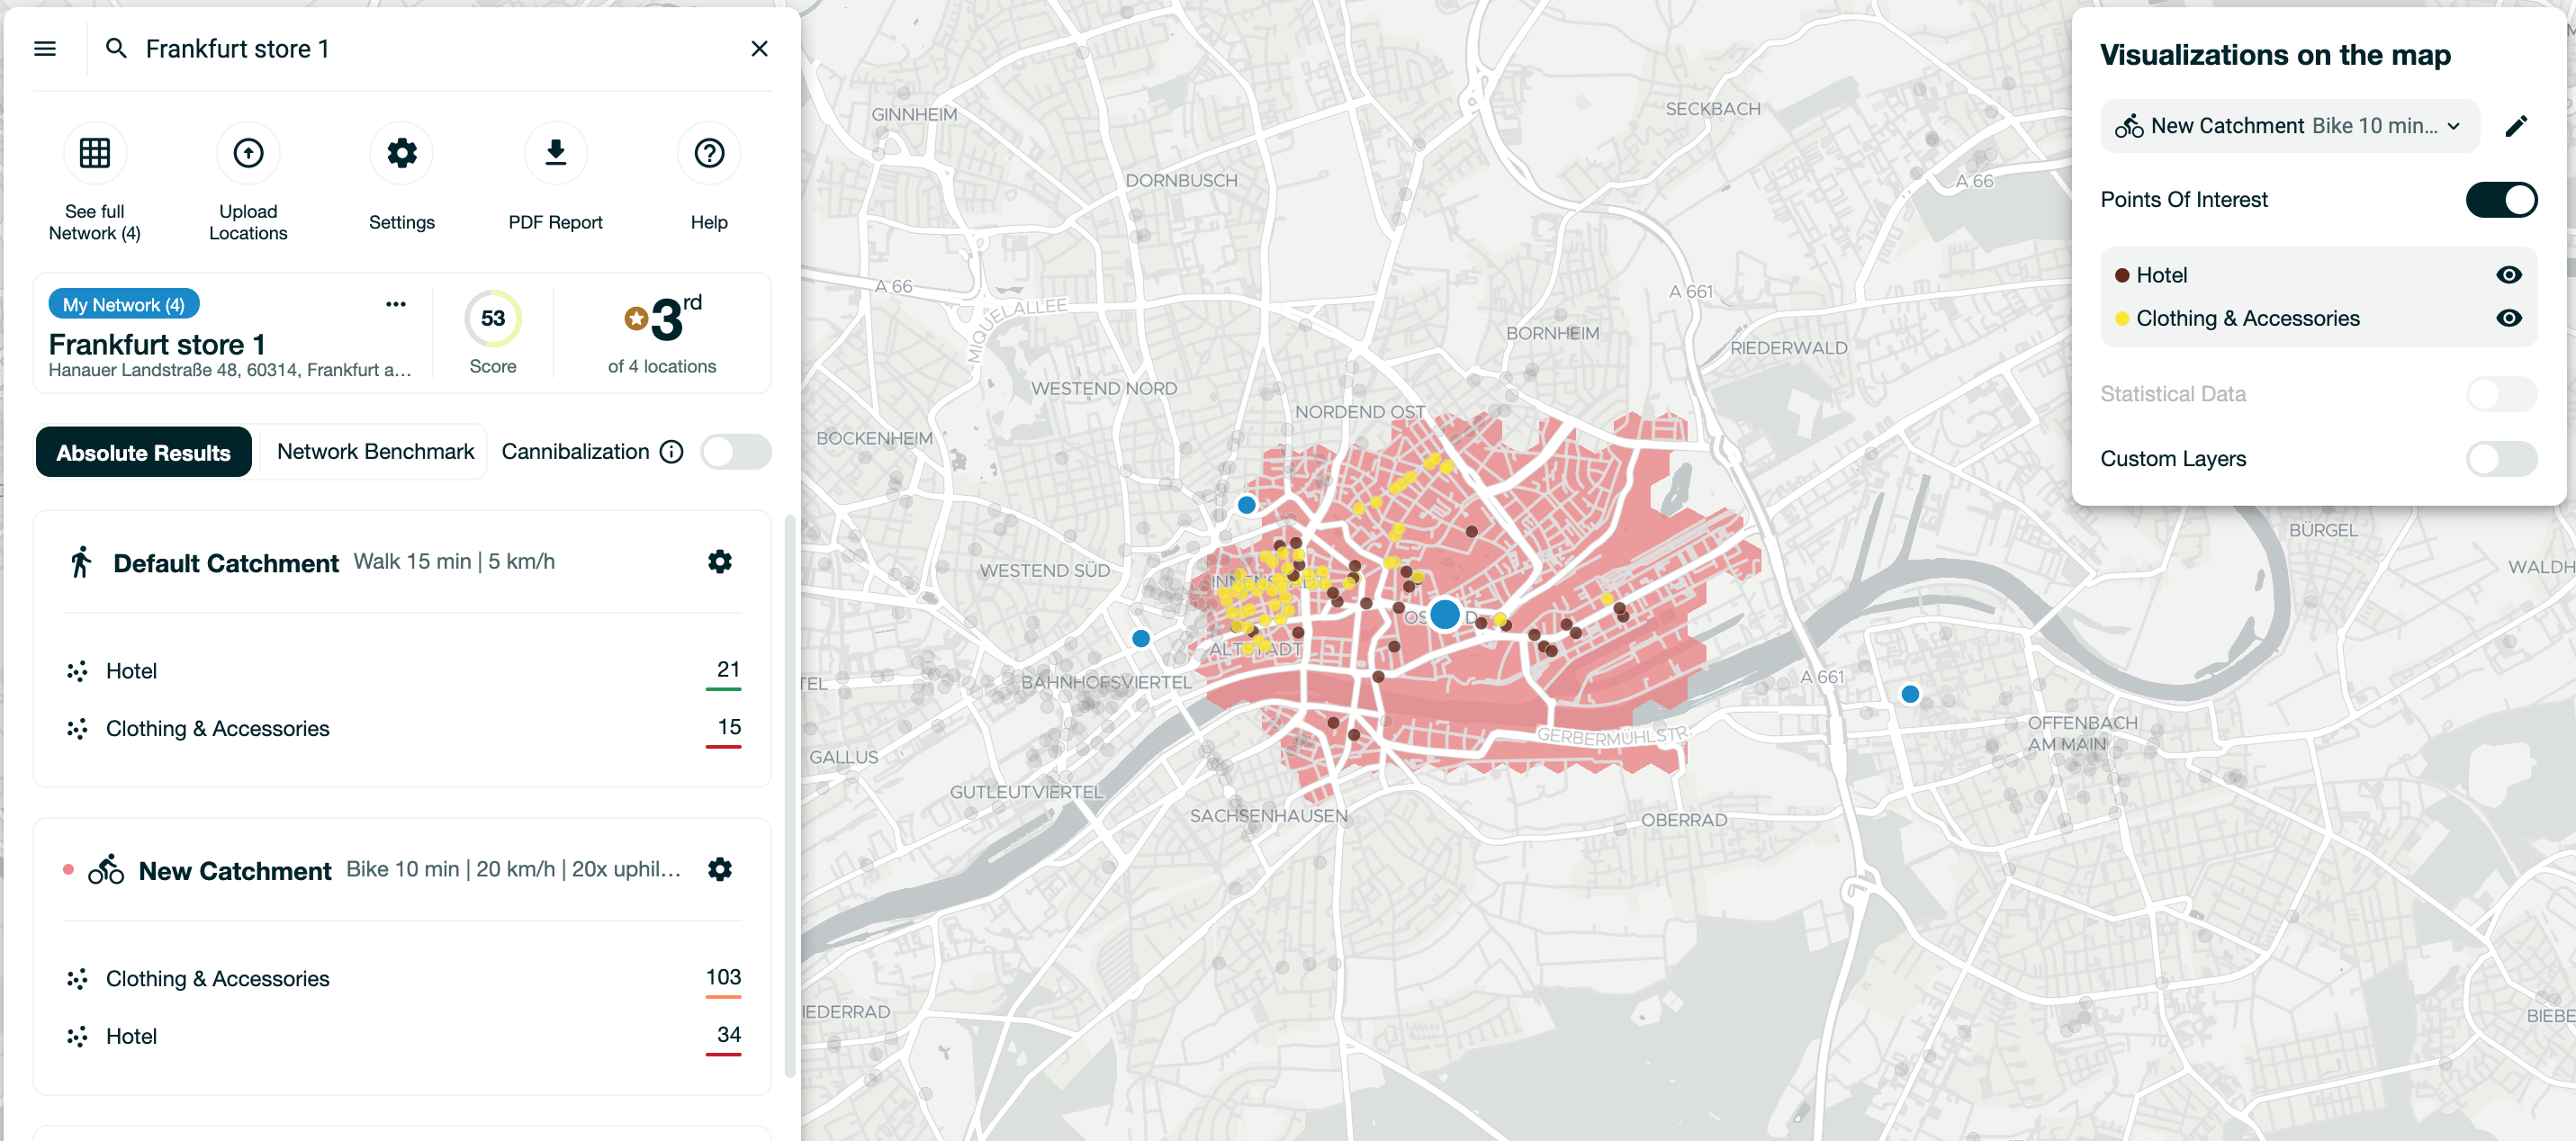
That means, for instance, that on the left side of the screen, you will be able to see data for all catchments at the same time.
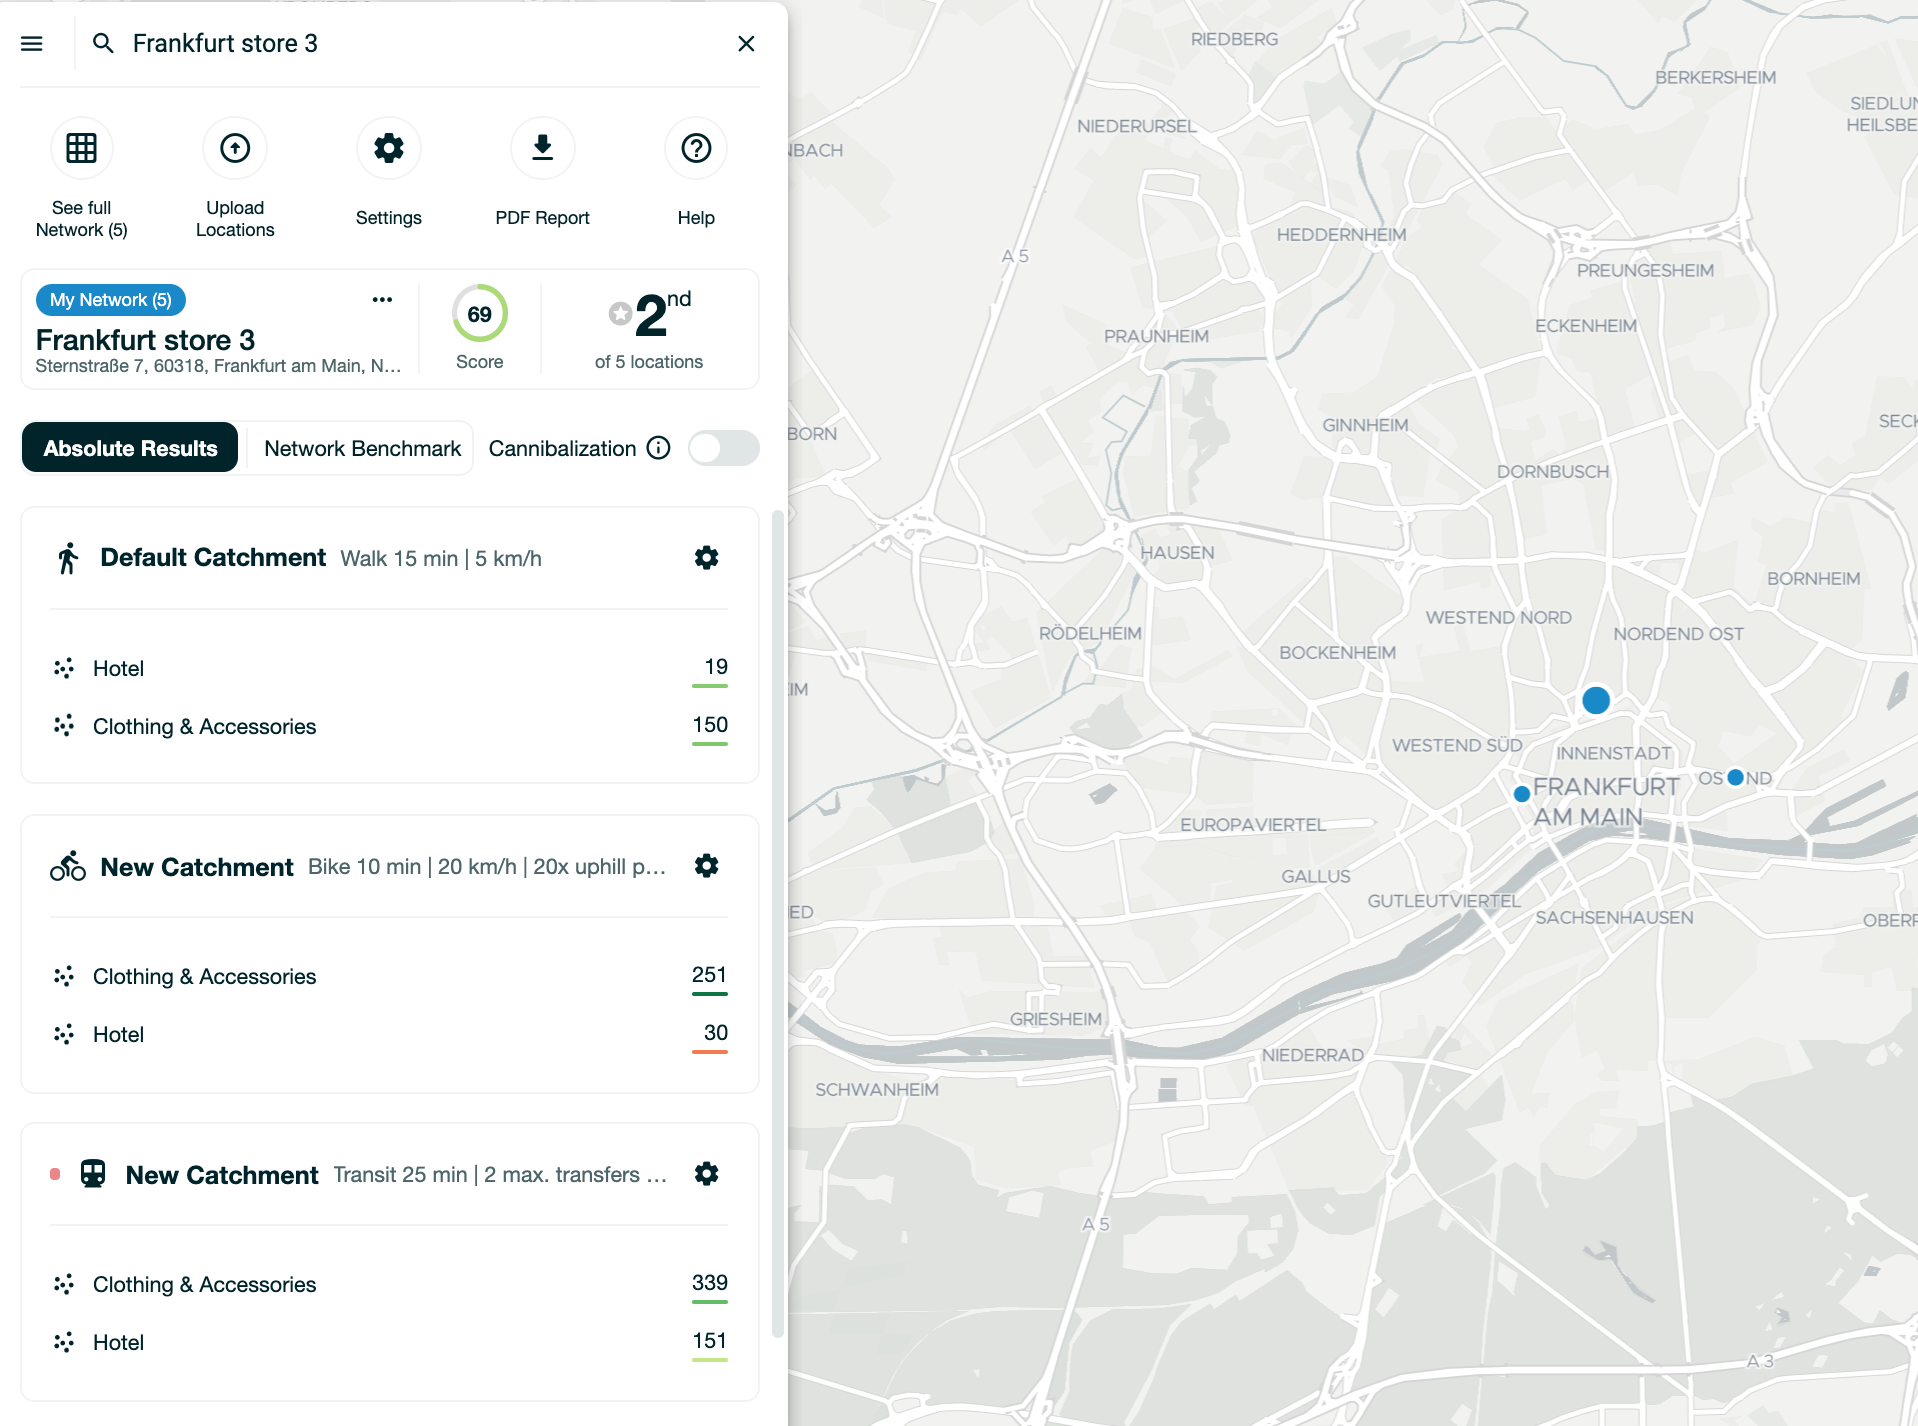
The same principle applies to the table and the scoring. There you will see a score that is calculated for all your catchments at once. The table will also show you data spanning over all your catchments individually.
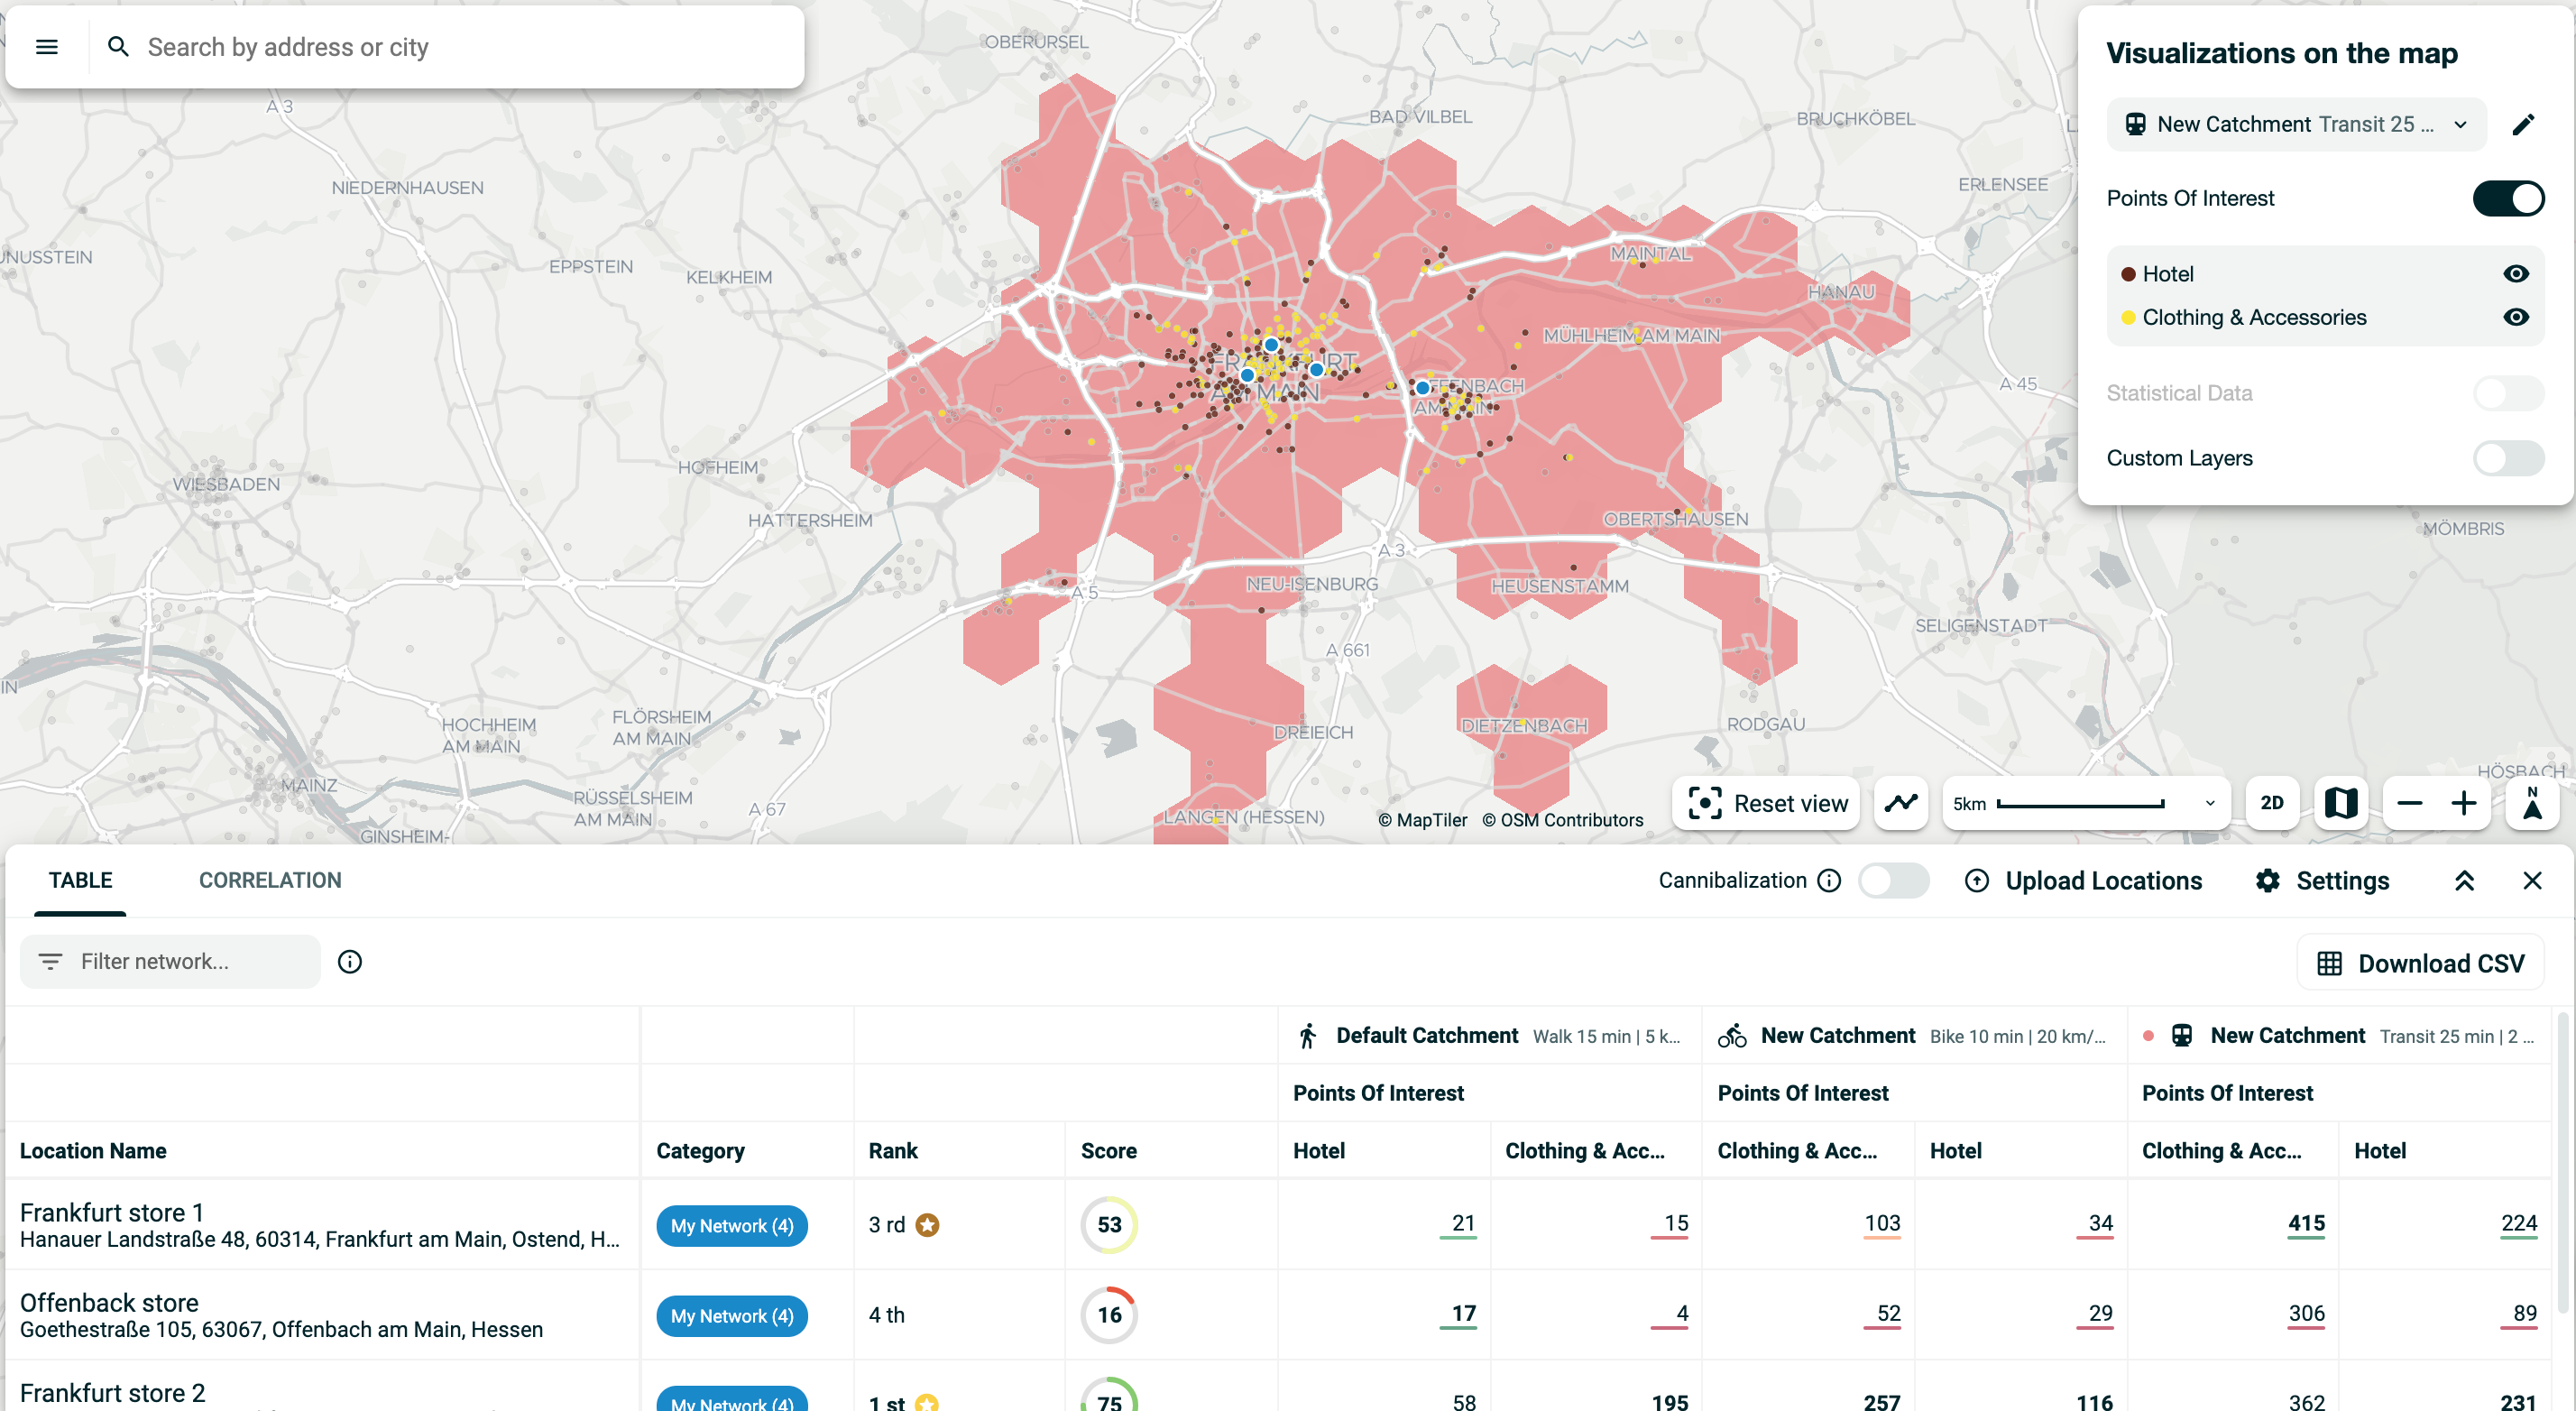
The visualisation on the map remains the same: you will continue to see location information on the left side, whilst the right panel will help you control what you see on the map - which catchment you will see and what data should be displayed
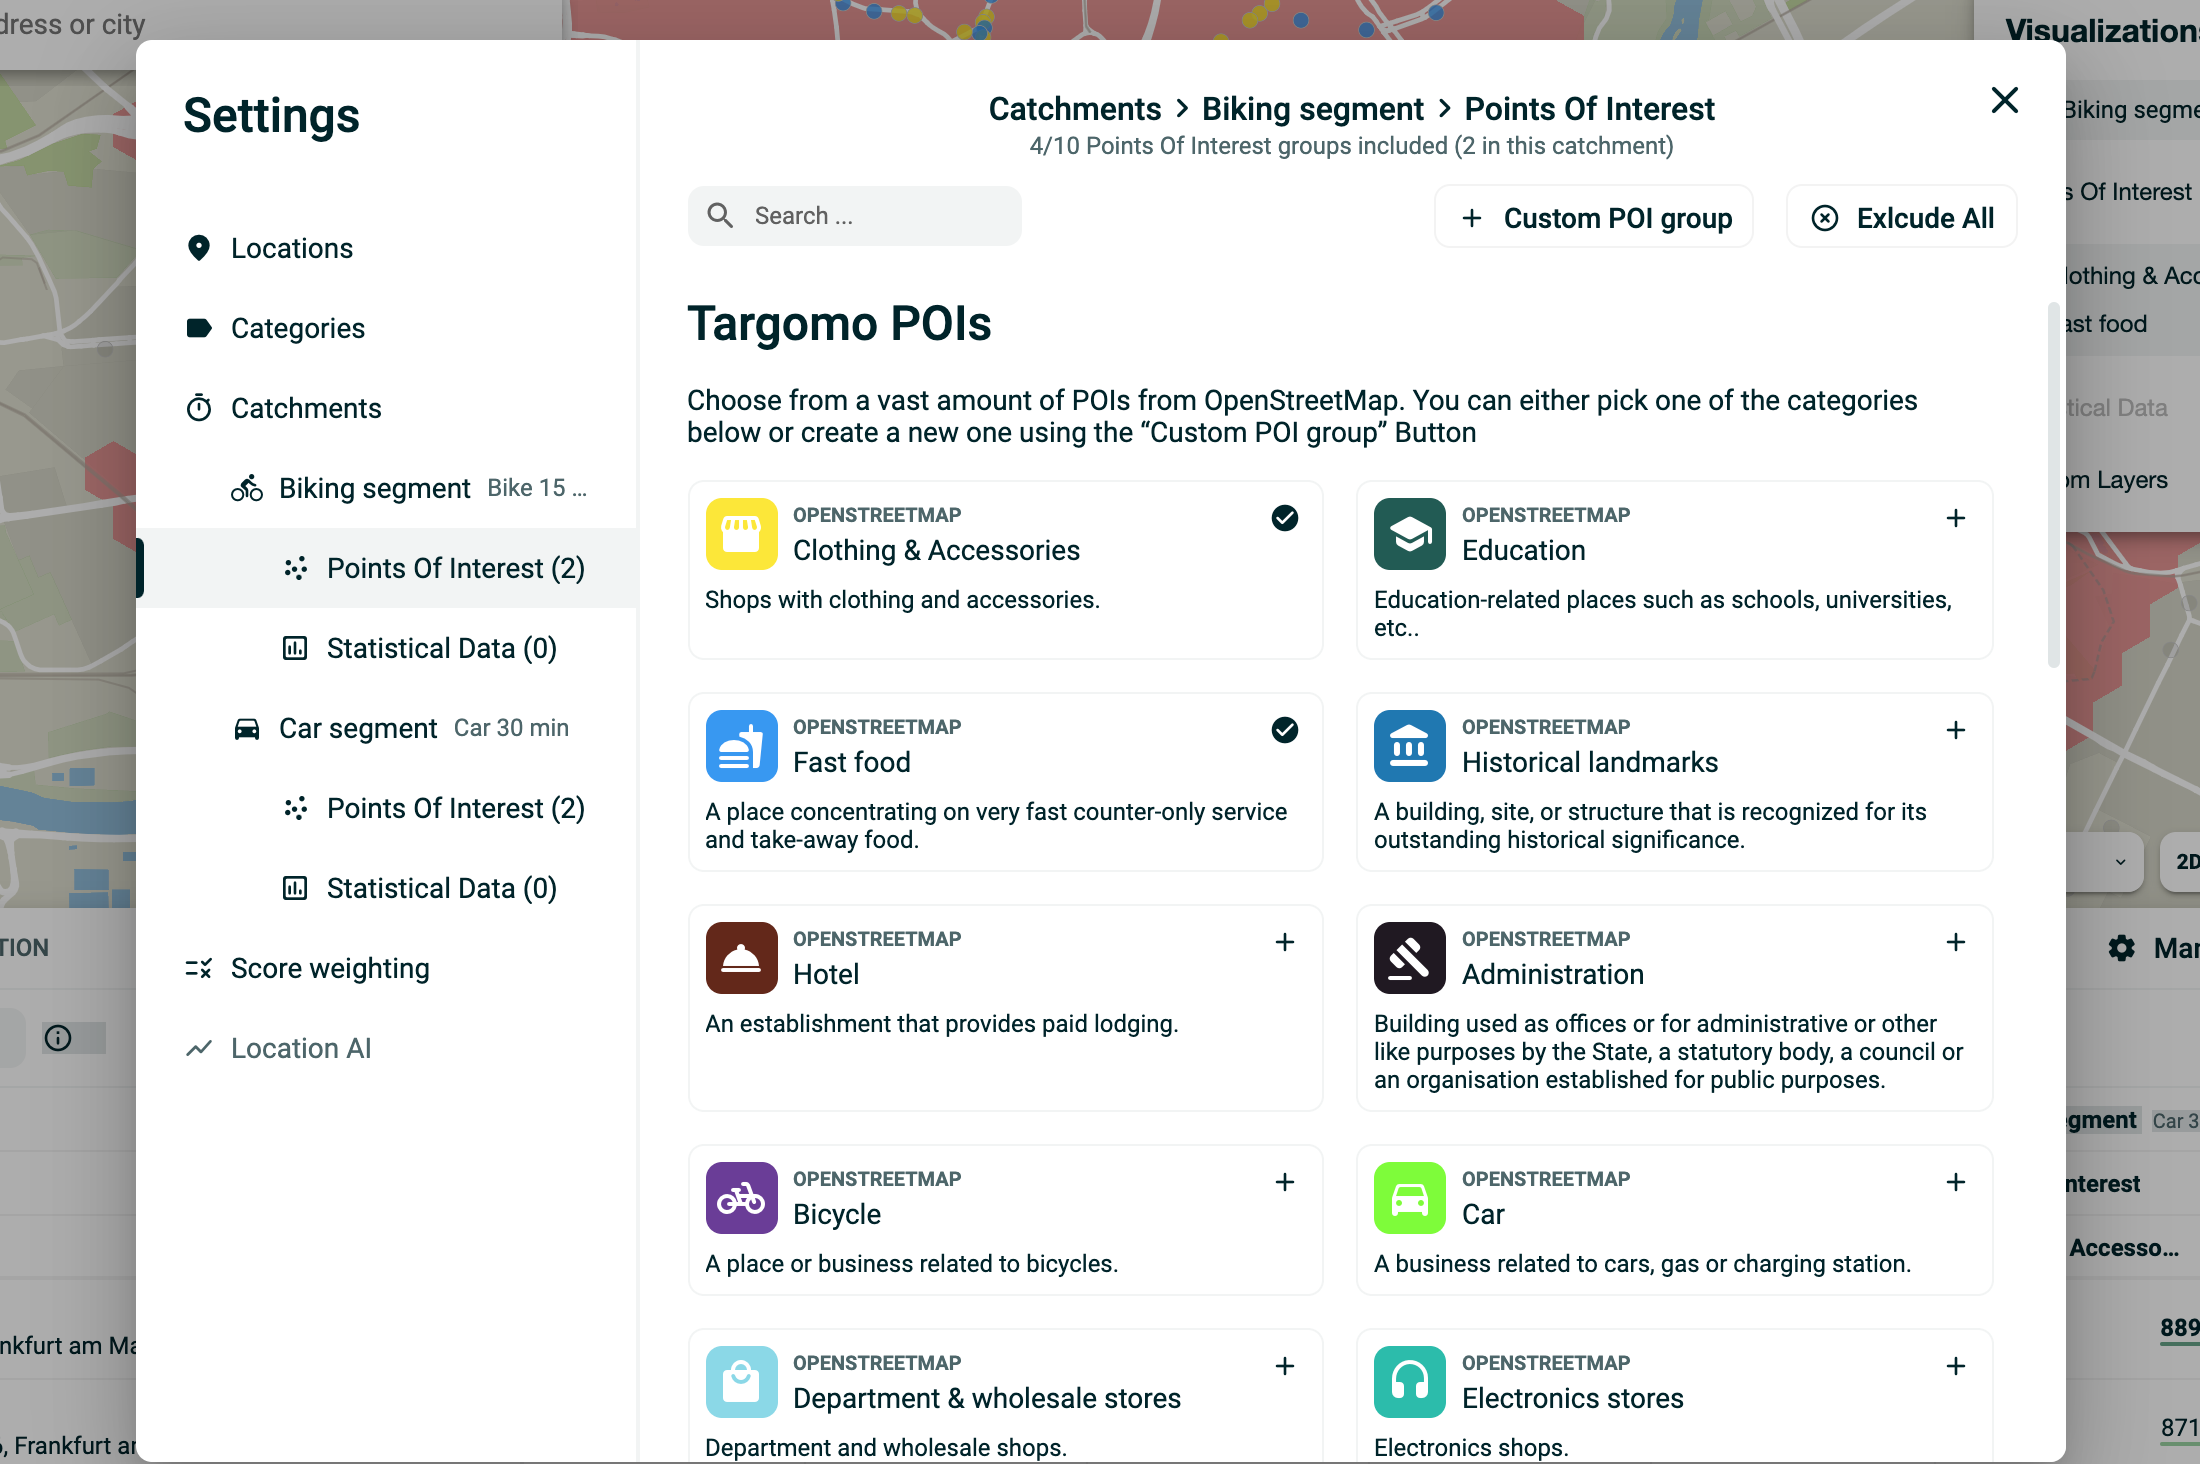
Another important change will be reflected on how you manage your settings. Previously you could only manage statistical data and point of interests for all your catchments at once. Now, you can decide independently what statistical data and point of interests are relevant for each one of your catchments. This is happening on the settings screen.
How will it impact my existing projects?
If you had multiple catchments in your project, each of them live under the section catchments in the settings. Only the first of your catchments will inherit the Point of Interests and Statistical data that was defined for all catchments before.
Score calculation for filtered networks
We've recently introduced a way for you to filter the networks in the table view. It makes it easier to view and compare data. To help you go further in the comparison of filtered networks, we are now making it possible for you to run a score calculation based on the networks you have filtered.
How does this feature work for you?
You will first need to filter for the locations you want to compare. Once this is done, you will see a new toggle "Base calculations on filtered network" appear. When you turn it on, the scores are automatically recalculated based on the locations that are filtered.
To go back to a scoring based on all your locations whilst still filtering for a few, simply turn the toggle "Base calculations on filtered network" off. By closing the filtering, the score will also automatically be recalculated based on all your available locations.