July 25th, 2023
Simulation and impact analysis
What is the impact of opening a new location? How much does it impact neighbouring locations? To answer these questions, we are introducing simulations to TargomoLOOP.
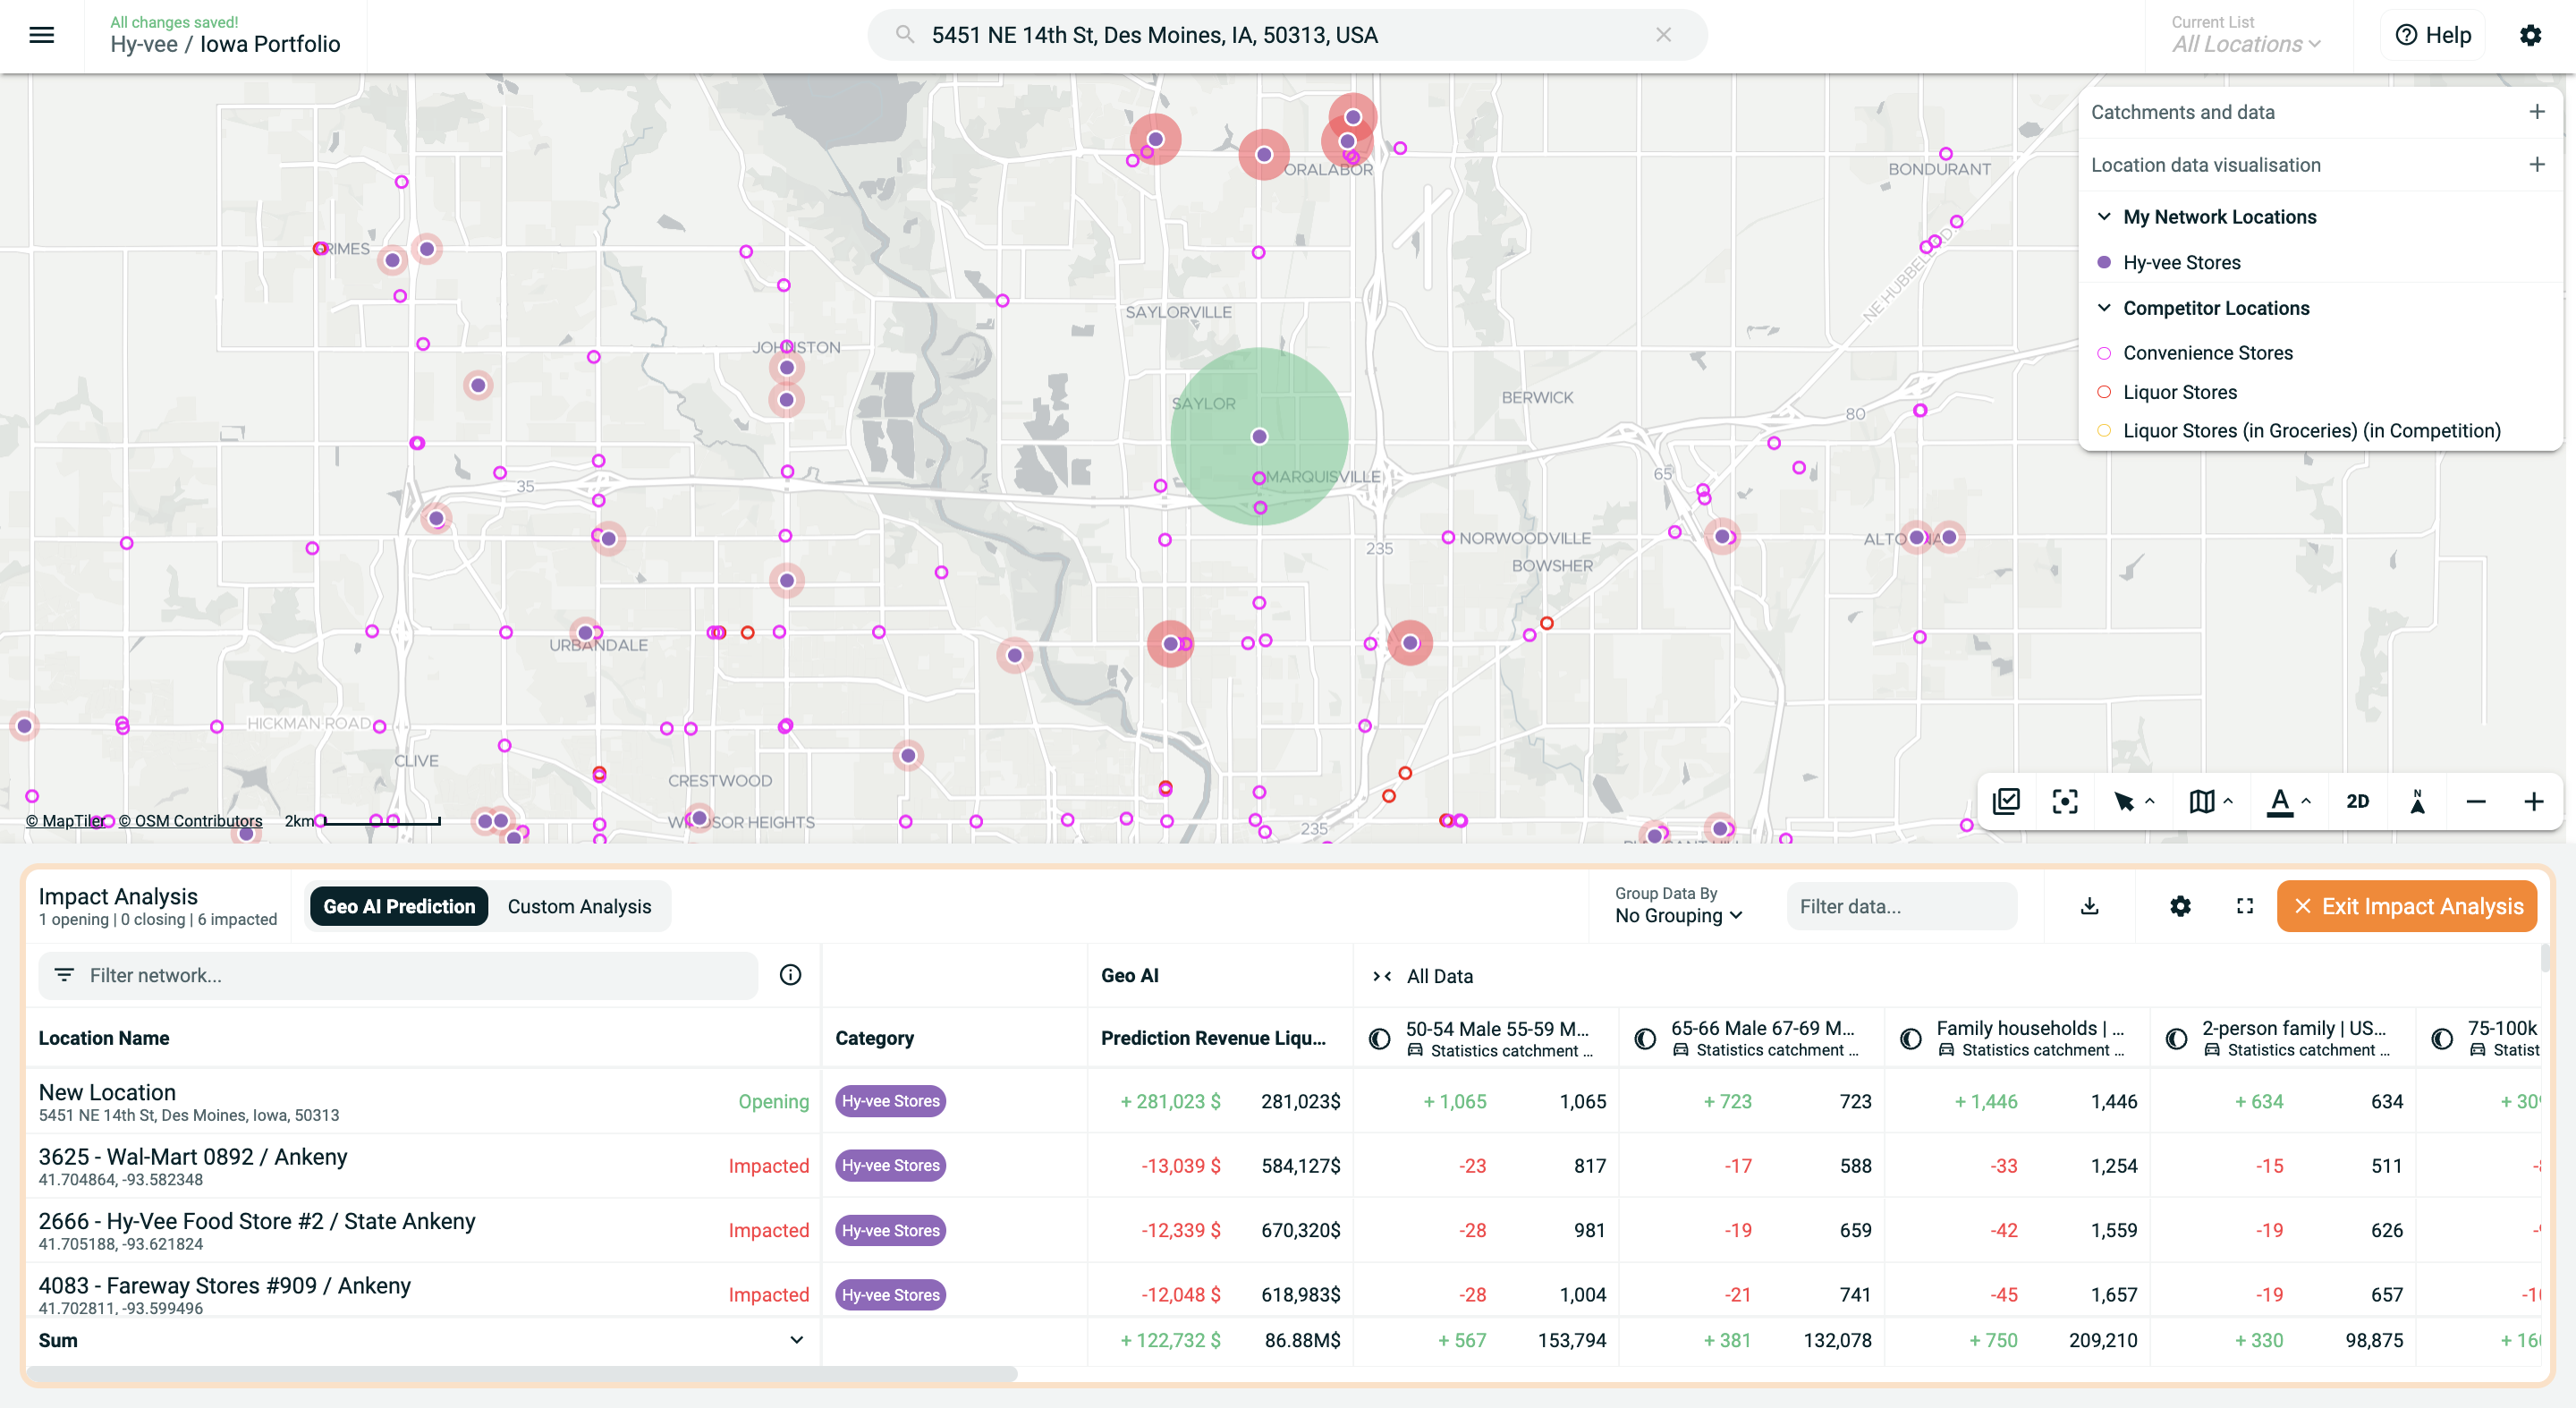
When analysing any location, you now have the opportunity to simulate its opening or its closing, and quantify the impact on neighbouring locations. You can see how much coverage you are gaining with a new location, or how much revenue, if you're using GEO-AI. To learn more, check out the video below (6:22)
New powerful visualisation
Demand visualisation
Where can you expect the customers coming to your store to come from? Where should you advertise?
To answer this question, we are introducing a new "Demand visualisation". When you enable this visualisation and choose the statistic "Total population", on the map, the areas that combine the most total population with the most attraction to your store will be highlighted. Conversely, areas that are either not attracted to your store or have few population will not be highlighted.
By combining statistics with attraction, two of the most factors in a store's success, this visualisation helps you see where potential demand could come from. More about this in the video below (3:48)
Visualise unreachable areas
Which sales areas do my store currently not cover? Is it significant? Would adding a new store help me cover this area?
To answer these questions, we are also introducing a new "Unreachable areas" visualisation. The principle is simple: when you select this visualisation, areas that your catchments do not cover will be highlighted on the map. Conversely, areas that your catchments cover will coloured in grey, to minimise their importance. Check out this video to learn more (1:12)