July 13th, 2022
Discover areas of weak coverage with the new travel time visualisation
When you need to see the areas you cover from those you don't, Targomo LOOP helps you find out where the limits of your catchment is. When it comes to discovering the areas of weak coverage within your catchments, you may feel like you're not equipped. That's why we are now introducing a new catchment visualisation based on travel time.
The greener the hexagons around your location(s), the closer they are. The redder the hexagons, the father from your location. This scale adapts to the catchment size, so that the hexagons in the darkest red are always the hardest to reach from your location(s).
Learn about the effect of cannibalisation on points of interest
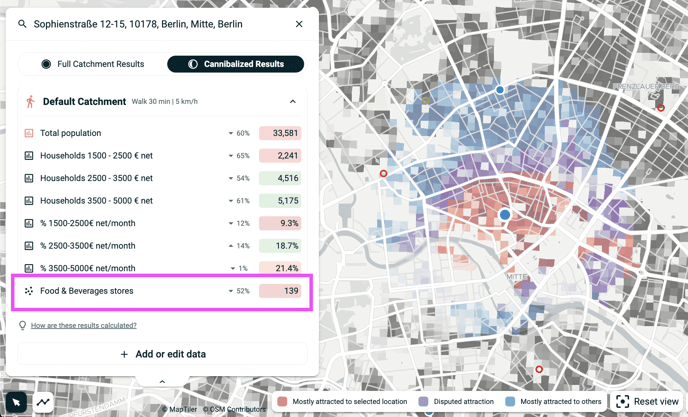
When you turn on cannibalisation, you will now also get cannibalised results for point of interests. This will be particularly useful when POIs represent your customers, such as restaurants or hotels, and you want to know how cannibalisation affects your potential business.
Find the right resources with the new help button
The help button has been redesigned, so that you can access the right resources when you need them.
A new colour interpolation for your data
When looking at the data for a location, it is convenient to know quickly whether it is higher or lower than the average for all your locations. That's why we have now changed the way your data is coloured:
- any data that is above your network average will coloured green; the greener, the closer it is to the best value within your entire network (i.e. all your locations that in LOOP, excluding competitors)
- any data that is below your network average will be coloured red; the redder, the closer it is to the worst value within your entire network (i.e. all your locations that in LOOP, excluding competitors)
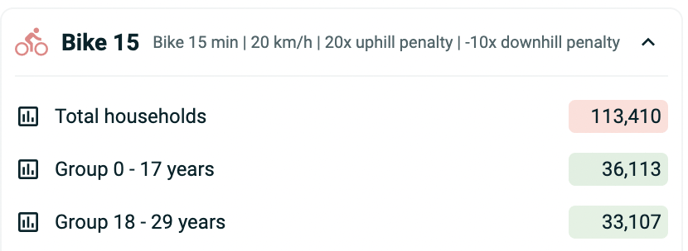
Looking at the above image, you can see that within 15 minutes biking from this location:
- there are 113,410 households, which is less than the average for the network
- there are 36,113 people aged 0 to 17 years old, which is more than the average for the network
Create scenarios by using lists and cannibalisation
When you create a list, only locations within this list and the locations listed as competitors will cannibalise the locations within this list. This means that for instance, if you want to close 2 locations and replace with a new one, you can analyse how this effects your network performance by creating a list without the 2 locations you consider closing and with this new location.